
 thesiswriter.pk@gmail.com |
  +92 3164838761
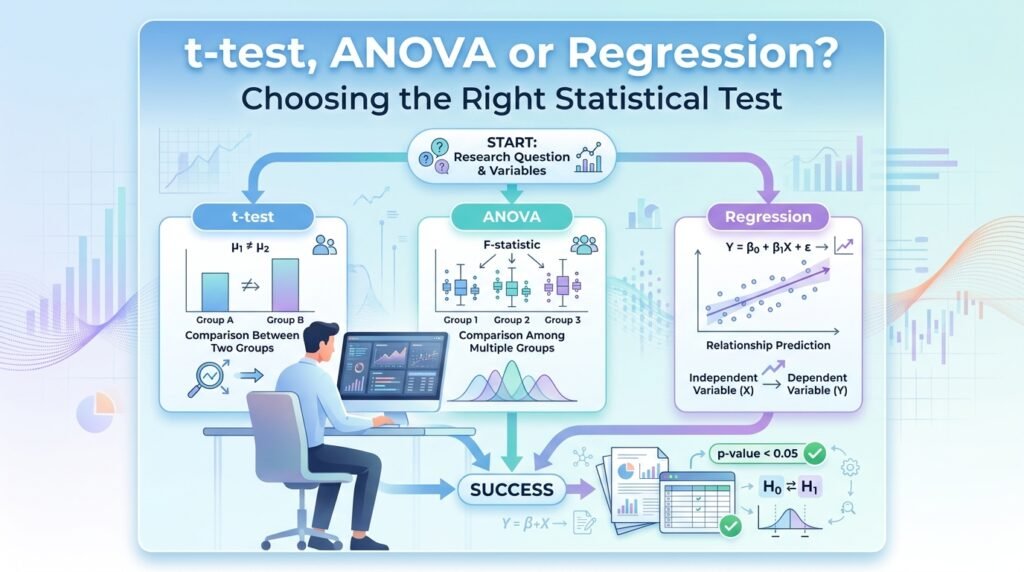
t-test, ANOVA or Regression? Choosing the Right Statistical Test
Choosing the wrong test is rejection reason #3 waiting to happen — and the choice is far more systematic than the anxiety around it suggests. The test follows from three properties you already know: what your research question asks (difference, relationship, or prediction), how your variables are measured, and how your groups are structured. This guide gives you the decision map, each test’s job and assumptions, the APA reporting line reviewers expect, and the classic mistakes — written for the researcher whose methods chapter is due, not the statistics exam.
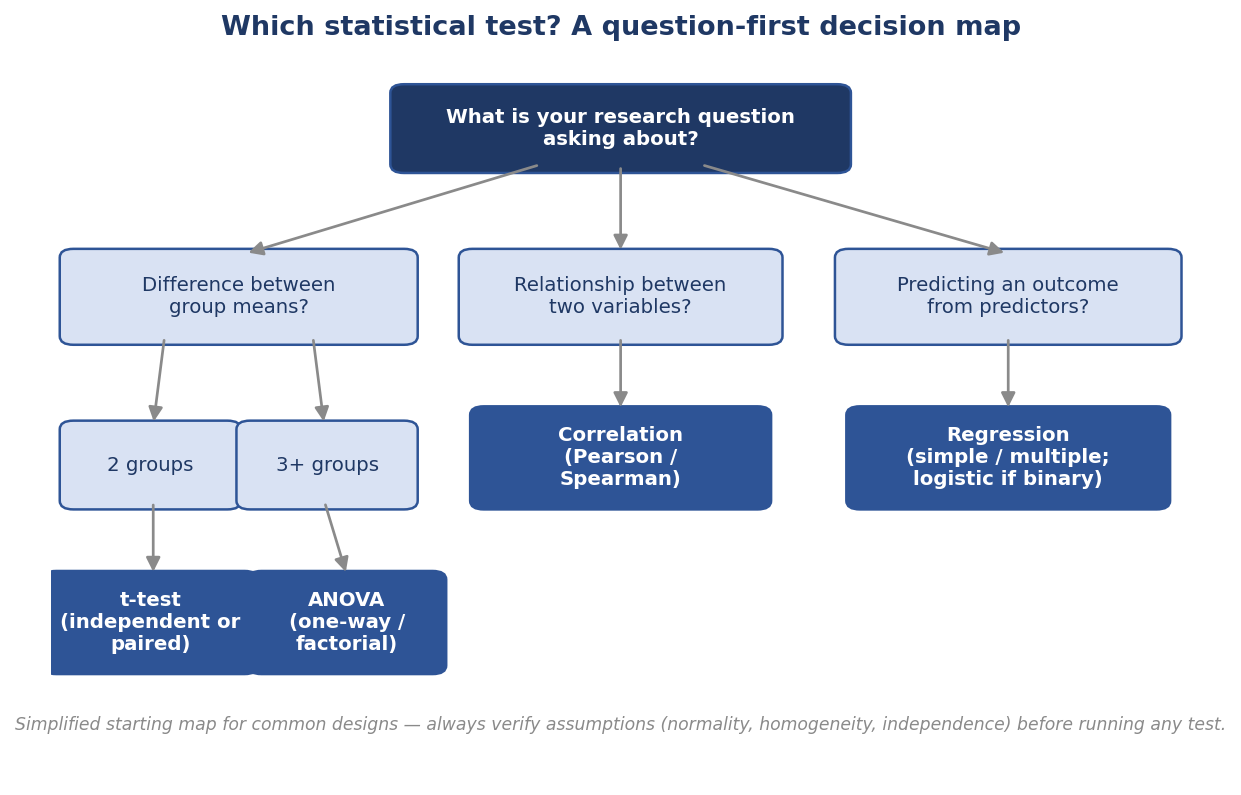
Figure 1. The question-first decision map. Start from what you’re asking, not from the test you remember.
Start with the question, not the software menu
Every common design reduces to one of three question types. Difference questions compare group means: do UAE and Malaysian respondents differ in adoption intention? Relationship questions ask whether two variables move together: is job satisfaction associated with tenure? Prediction questions model an outcome from one or more predictors: do perceived usefulness and ease of use predict adoption, controlling for age? Name your question type first — the map above does the rest — then confirm the choice against measurement and assumptions below. (Working in JASP or jamovi rather than SPSS changes nothing here; the logic is identical, as our free-tools guide notes.)
Before any test: describe first
Every inferential choice sits on descriptive foundations, and skipping them is how mismatched tests happen. Before the map, produce: means, standard deviations, and ranges per variable and per group; a distribution look (histogram or normality test, remembering that large-sample normality tests flag trivial deviations); a missing-data count with your handling decision stated; and — for scales — reliability (Cronbach’s alpha, with .70 the conventional floor). Two payoffs: the descriptives table is required reporting anyway (rejection reason #4 lives here), and the distribution look frequently answers the parametric-or-not question before any assumption drama begins.
The t-test: two means
Job: compare the means of exactly two groups. Independent-samples t-test for two different groups (male/female, treatment/control); paired-samples for the same group measured twice (pre/post training). Requirements: a continuous outcome, approximately normal within groups (or a sample large enough for the test’s robustness), and — for the independent version — roughly equal variances, with Welch’s correction as the standard remedy when they aren’t. Report effect size alongside significance: reviewers increasingly treat a p-value without Cohen’s d as incomplete. APA line: t(58) = 2.31, p = .024, d = 0.60.
ANOVA: three or more means
Job: compare means across three or more groups (one-way ANOVA: adoption intention across three countries) or across combinations of factors (factorial ANOVA: country × gender, which also tests their interaction). Why not multiple t-tests? Each additional pairwise test inflates the false-positive rate — three groups tested pairwise at α = .05 pushes familywise error toward 14% — which is exactly what ANOVA’s single omnibus F-test prevents. A significant F says “at least one difference exists”; post-hoc tests (Tukey’s HSD as the default) say where. Report η² or partial η² for effect size. APA line: F(2, 87) = 5.12, p = .008, η² = .11, with post-hoc results following.
Correlation: two variables, no direction
Job: quantify how two continuous variables move together, with no claim about which drives which. Pearson’s r for linear relationships between reasonably normal variables; Spearman’s rho for ordinal data or when outliers and non-linearity make ranks safer. The number runs −1 to +1; by common convention, magnitudes around .10, .30, and .50 read as small, medium, and large. The eternal caveat belongs in your discussion, not just your statistics class: correlation supports association, never causation — and reviewers penalize causal verbs on correlational designs (overclaiming, rejection reason #7). APA line: r(118) = .42, p < .001.
Regression: prediction and control
Job: model an outcome from predictors. Simple regression extends correlation with a directional model; multiple regression is where research questions usually live — estimating each predictor’s contribution while holding the others constant, which is what “controlling for age and experience” means operationally. Key outputs: R² (variance explained), F for the overall model, and per-predictor coefficients with β, t, and p. Binary outcome (adopt/not adopt)? Logistic regression, reporting odds ratios. Assumptions worth actually checking: linearity, independence, homoscedasticity, approximately normal residuals, and no severe multicollinearity (VIF below common thresholds). APA line: the model explained a significant proportion of variance, R² = .38, F(3, 116) = 23.7, p < .001; perceived usefulness was the strongest predictor, β = .41, t = 5.2, p < .001.
Worked mini-case: question to reported result
A composite shaped like a hundred master’s projects. Question: does adoption intention differ across three user groups, and what predicts it? Two question types, so two tests — the map applied twice. Difference branch: three independent groups, continuous composite outcome (four-item scale, α = .84, treated as continuous per convention, stated explicitly) → one-way ANOVA. Assumption checks: distributions acceptable, Levene’s test non-significant. Result written for the manuscript: adoption intention differed significantly across groups, F(2, 147) = 6.90, p = .001, η² = .09; Tukey post-hocs located the difference between early adopters and laggards (p < .001), with the middle group differing from neither. Prediction branch: three predictors, continuous outcome → multiple regression, VIFs all under 2, residuals well-behaved. Reported: the model explained R² = .41, F(3, 146) = 33.8, p < .001, with perceived usefulness the strongest predictor (β = .44, p < .001) and age non-significant once usefulness was controlled — a sentence that answers the actual research question, which is the entire point of the exercise.
The chooser table
| Your question | Groups / variables | Test | Effect size to report |
| Do two groups differ on a mean? | 2 independent groups | Independent t-test (Welch if variances unequal) | Cohen’s d |
| Did scores change within people? | Same group, 2 time points | Paired t-test | Cohen’s d |
| Do 3+ groups differ? | 3+ independent groups | One-way ANOVA + post-hoc | η² |
| Do factors interact? | 2+ factors | Factorial ANOVA | partial η² |
| Do two variables move together? | 2 continuous | Pearson r (Spearman if ordinal/non-normal) | r itself |
| What predicts the outcome? | 1+ predictors, continuous outcome | Multiple regression | R², βs |
| What predicts a yes/no outcome? | 1+ predictors, binary outcome | Logistic regression | Odds ratios |
When assumptions fail: the non-parametric ladder
Assumption violations have standard exits, and naming the right one in your methods section reads as competence rather than compromise. Independent t-test → Mann-Whitney U; paired t-test → Wilcoxon signed-rank; one-way ANOVA → Kruskal-Wallis. Modest non-normality with decent samples often needs no exit at all — the parametric tests are robust — but report the assumption checks either way, because unreported checks are incomplete reporting (rejection reason #4), and reviewers in quantitative fields look for them specifically.
Just off the map: chi-square and friends
The map covers continuous-outcome designs; two adjacent tools complete the everyday kit. Chi-square tests of independence handle two categorical variables — does adoption (yes/no) depend on sector (public/private)? Report χ², df, p, and Cramér’s V for effect size, and mind the expected-count-per-cell convention. And when your “groups” are the same people measured three or more times, repeated-measures ANOVA (with sphericity checked and corrected via Greenhouse-Geisser as needed) replaces its between-groups sibling. Both slot into the same discipline: question type first, measurement second, assumptions checked and reported third.
The reporting checklist (one paragraph per test)
Reviewers can approve only what they can verify, so every reported test carries: the test named with its justification (question type and measurement), assumption checks and any remedies (Welch, Greenhouse-Geisser, non-parametric exit), the statistic with degrees of freedom, the exact p-value, the effect size, and — for models — the overall fit before the coefficients. One template sentence per element, reused across the results chapter, converts statistical reporting from a memory test into an assembly job — and preempts the “incomplete reporting” comment before it’s written.
The classic mistakes reviewers catch
- Multiple t-tests where ANOVA belongs — the inflated-error problem above; reviewers flag it by reflex.
- Causal language on correlational output — “affects,” “drives,” and “leads to” on cross-sectional survey data is overclaiming in its purest form.
- Significance without effect size — p tells you an effect probably exists; d, η², and R² tell you whether it matters. Journals increasingly require both.
- Assumption checks run but unreported — or worse, not run. One sentence per check is the entire cost.
- Ordinal data fed to Pearson — five-point single items are ranks; Spearman exists for exactly this. (Multi-item averaged scales are conventionally treated as continuous — say so explicitly.)
One-tailed or two-tailed?
Default to two-tailed tests and say so. One-tailed tests are defensible only with a genuinely directional hypothesis stated in advance — and because halving the p-value after seeing the data is a recognized questionable practice, reviewers treat unexplained one-tailed reporting as a flag. The safe pattern: two-tailed throughout, direction discussed via the sign of the effect.
The takeaway
Test choice is a lookup, not a leap: question type picks the family (difference → t-test or ANOVA; relationship → correlation; prediction → regression), measurement and group structure pick the member, assumption checks confirm or redirect to the non-parametric ladder, and the APA reporting line — statistic, degrees of freedom, exact p, effect size — closes the loop. Describe first, choose by the map, check and report assumptions, and pair every p-value with its effect size. Do those four things consistently and the statistics section stops being where your manuscript is vulnerable and becomes where it quietly earns reviewer trust — which, as our rejection-reasons post shows, is the section where quantitative papers most often live or die.
FAQs
My data are Likert scales — parametric or not? The working convention: single Likert items are ordinal (non-parametric or Spearman); multi-item scales averaged into composites are treated as approximately continuous, making t-tests, ANOVA, and regression standard. State the convention you’re following in your methods — reviewers accept either position argued explicitly.
How large a sample do I need? Decide before collecting, via power analysis (G*Power is free): detecting a medium effect at conventional power typically demands dozens per group for t-tests and ANOVA, and more as regression models add predictors. Post-hoc, justify honestly — and temper claims where power is thin rather than hoping reviewers won’t ask. They ask.
A reviewer asked for a test I’ve never run. Now what? Almost always a standard procedure with a standard menu path — learnable on your own dataset in a coached session or two, then reported in a paragraph. What you should not do is bluff the write-up or ignore the comment; both are detectable, and both are fatal in ways the learning curve isn’t.
Should I learn R instead of using SPSS-style tools? For most manuscripts, the deciding skill is test selection and reporting, not the engine — and jamovi’s live syntax mode lets you absorb R gradually while producing correct results today. Learn R deliberately when reproducibility requirements, advanced models, or your field’s norms demand it; never let the tool debate delay the analysis.
What about moderation, mediation, and SEM? Natural extensions once the map’s logic is internalized: moderation is regression with an interaction term (an ANOVA idea imported into prediction), mediation decomposes a predictor’s effect into direct and indirect paths (commonly via the PROCESS macro or its equivalents), and structural equation modeling generalizes regression across multiple equations with latent variables — demanding larger samples and explicit fit reporting. If your hypotheses use the words “strengthens,” “weakens,” or “through,” you’re already in this territory, and the same discipline applies: question first, assumptions checked, effect sizes reported.